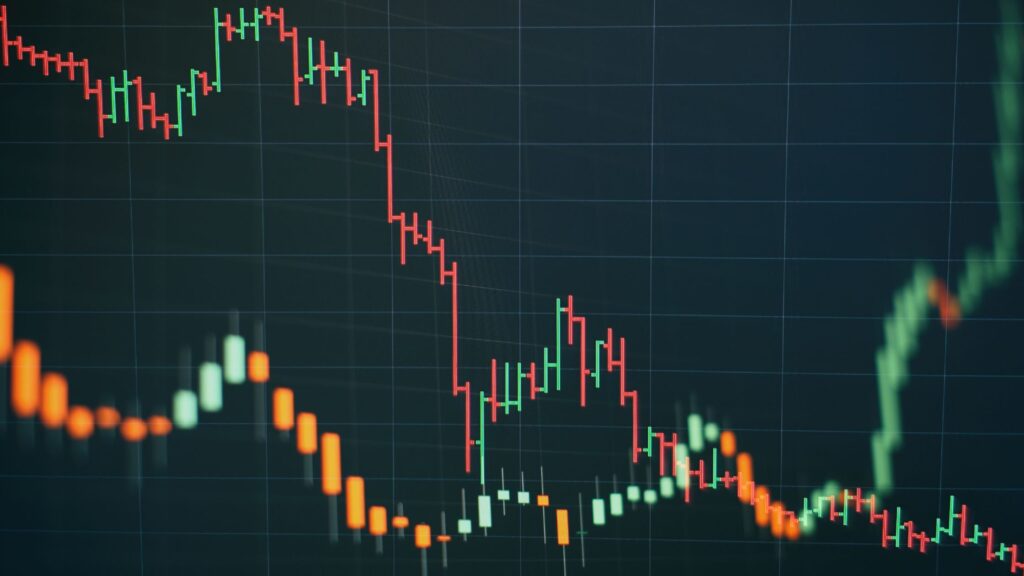
Crypto trading is fast-paced and highly volatile, making it crucial for traders to identify reliable indicators for market movement. One of the most essential tools in technical analysis is trend lines. These lines help traders detect market trends, find potential support and resistance levels, and make informed trading decisions. In this guide, we’ll explore common trend lines in crypto trading, their importance, and how you can use them to refine your trading strategy.
What Are Trend Lines?
A trend line is a straight line that connects two or more significant price points on a price chart, representing the general direction of the market. They help traders determine whether an asset is in an uptrend, downtrend, or moving sideways.

Types of Trend Lines
- Uptrend Line (Support Line)
- Connects higher lows in an upward-moving market.
- Suggests buying opportunities.
- Example: BTC/USD increasing from $30,000 to $50,000 with higher pullback lows.
- Downtrend Line (Resistance Line)
- Connects lower highs in a downward-moving market.
- Suggests selling or shorting opportunities.
- Example: ETH/USD declining from $2,500 to $1,800 with lower peaks.
- Horizontal Trend Line (Support and Resistance)
- Represents a static level where price has consistently bounced.
- Acts as support when price stays above and resistance when price stays below.
- Example: BTC repeatedly bouncing from $40,000 support.
How to Draw Trend Lines Correctly
To ensure your trend lines are accurate and effective, follow these best practices:
- Use at least two price points – A trend line must connect at least two swing highs or lows.
- Avoid cutting through the price candles – The line should only touch wicks and the bodies where necessary.
- Adjust for accuracy – Markets evolve, and trend lines may need adjustments.
- Consider different time frames – Trend lines can vary between short-term and long-term analysis.
How to Use Trend Lines in Crypto Trading

1. Identifying Support and Resistance Levels
Trend lines help spot potential support and resistance levels. When the price approaches these levels, traders anticipate possible reversals or breakouts.
- Support Example: If BTC consistently bounces from $40,000, traders view it as a strong support level.
- Resistance Example: If ETH struggles to break above $2,000, it’s seen as a resistance zone.
2. Using Trend Line Breakouts
A breakout occurs when the price crosses a trend line with strong momentum. Traders use these as signals for new trade entries.
- Bullish Breakout: Price breaks above a downtrend line → Potential buying opportunity.
- Bearish Breakdown: Price falls below an uptrend line → Potential shorting opportunity.
3. Combining Trend Lines with Other Indicators
While trend lines are powerful, combining them with technical analysis tools increases their effectiveness:
- Moving Average Convergence Divergence (MACD) – Confirms trend direction.
- Relative Strength Index (RSI) – Identifies overbought or oversold conditions.
- Price Points & Volume Analysis – Higher volume during breakouts strengthens signals.

Common Mistakes to Avoid
- Forcing Trend Lines – Don’t draw trend lines to fit a bias; use actual market data.
- Ignoring Volume Confirmation – A breakout without volume confirmation can be a fake-out.
- Not Adjusting for Market Conditions – Trend lines evolve; periodically reassess them.
Trend Line Trading Strategies
1. Trend Reversal Trading
- Look for a trend reversal when the price breaks a well-established trend line.
- Confirm the reversal with RSI divergence or MACD crossover.
2. Trend Continuation Trading
- Identify trend lines in strong market trends.
- Enter trades on retracements to support or resistance levels.
- Example: Buying BTC on a pullback to a long-term uptrend line.
3. Price Breaks & Stop Loss Orders
- Place stop-loss orders below support in an uptrend and above resistance in a downtrend.
- Adjust stops dynamically as new trend lines form.
Final Thoughts
Trend lines in crypto trading are essential for spotting market movements, support and resistance levels, and breakout opportunities. By drawing them correctly and combining them with MACD, RSI, and volume analysis, traders can improve their decision-making and reduce risks.

If you’re looking to master technical analysis tools and gain an edge in crypto trading, start implementing trend line strategies today!
Key Takeaways
✔ Trend lines help identify market trend direction.
✔ Use support and resistance levels for trade entries.
✔ Combine with RSI, MACD, and volume analysis.
✔ Avoid common mistakes like forcing trend lines.
✔ Adjust for short-term and long-term market trends.
Would you like to learn more advanced strategies? Stay tuned for more expert guides on crypto green force.
Frequently Asked Questions (FAQs)
1. What is the best time frame for drawing trend lines in crypto trading?
The best time frame depends on your trading strategy. Short-term traders may use 1-hour or 4-hour charts, while long-term investors often use daily or weekly charts.
2. Can trend lines be used alone for trading decisions?
No, trend lines are most effective when combined with other technical indicators like MACD, RSI, and volume analysis.
3. How can I confirm a breakout from a trend line?
A confirmed breakout should be accompanied by higher trading volume, a candlestick close beyond the trend line, and possibly other indicators like RSI divergence.
4. Do trend lines work in all market conditions?
Trend lines are useful in trending markets but may be less reliable in sideways or highly volatile conditions.
5. How often should I adjust my trend lines?
Markets evolve, so trend lines should be updated periodically to reflect new price movements.


