
In the world of cryptocurrency trading and investment, charts and technical indicators play a pivotal role in making informed decisions. One such tool that has garnered significant attention is the Crypto Rainbow Chart. This chart provides investors with a unique visual representation of Bitcoin’s historical price performance, helping them make predictions about future trends. Now we will explore what the Crypto Rainbow Chart is, how it works, and how it can be utilized to enhance your trading strategies.
What is the Crypto Rainbow Chart?
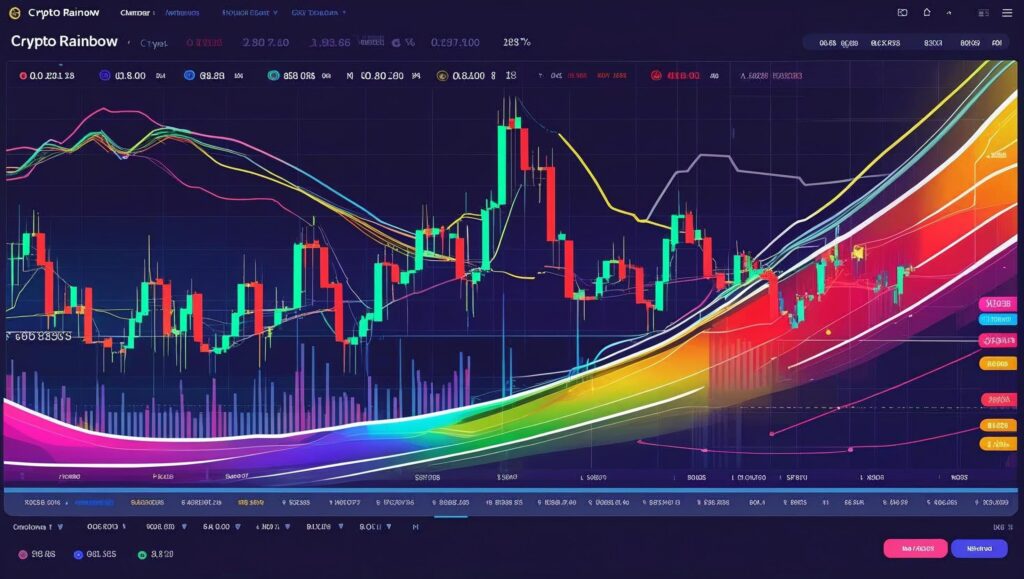
The Crypto Rainbow Chart visualizes Bitcoin’s price changes using color gradients to indicate market cycles, from corrections to bullish peaks. Each color represents a specific price range, helping traders assess whether the market is oversold or overbought. It provides insights into Bitcoin’s position in its market cycle, making it a valuable tool for long-term investors considering historical trends.
How the Crypto Rainbow Chart Works
The chart consists of seven color bands, each representing a stage of Bitcoin’s price movement, and these range from deep red (indicating a market bubble) to purple (indicating a deeply oversold market).
Color Bands Explained:
- Deep Red: Bitcoin’s price is overvalued, signaling a “bubble.”
- Light Red: An overbought condition, but less extreme.
- Orange: Still overbought, but showing signs of cooling.
- Yellow: Neutral phase, where the price is balanced.
- Green: Healthy price zone, often after a correction.
- Blue: Deeply oversold, suggesting a potential buying opportunity.
- Purple: Significantly undervalued, indicating a heavily oversold market.
These color bands provide an easy-to-understand approach, blending technical analysis with intuitive design, helping investors assess whether Bitcoin is overvalued or undervalued.

Benefits of Using the Crypto Rainbow Chart
The Crypto Rainbow Chart provides several advantages to cryptocurrency traders and investors:
1. Easy to Read
Its color-coded nature makes it incredibly user-friendly, even for beginners, where the visual simplicity allows traders to grasp market conditions at a glance.
2. Helps Predict Trends
By analyzing past market cycles, you can better predict the future price movements of Bitcoin. This makes it a valuable tool for making informed decisions.
3. Risk Management
Understanding when Bitcoin is overbought or oversold can help investors manage risks and avoid buying at the peak of a bubble or selling at the bottom.
4. Long-Term Investment Insights
It offers valuable insights for long-term investors who want to understand the bigger picture of Bitcoin’s price history and make decisions accordingly.
How to Use the Crypto Rainbow Chart for Trading
While the Crypto Rainbow Chart is not a guarantee of future success, it can provide significant insights into potential market movements. Here are some strategies for using the chart effectively:
1. Buying During Oversold Conditions
When Bitcoin enters the blue or purple bands, it may be a good opportunity to buy, as the price is likely to rebound in the future. These bands indicate a market where Bitcoin is underpriced, creating a potential buying opportunity.
2. Sell During Overbought Conditions
If Bitcoin reaches the red or orange bands, it could be a sign that the market is overheated, making it a good time to consider selling. Selling at these points could help you avoid holding during a potential price correction.
3. Monitor Market Sentiment
The chart can also help gauge the overall market sentiment. When Bitcoin moves from one color to another, it might signal a shift in market sentiment that could indicate a trend reversal.
4. Combined with Other Indicators
The Crypto Rainbow Chart should be used alongside other technical indicators such as moving averages and volume analysis. By combining these tools, you can develop a more comprehensive trading strategy.
Is the Crypto Rainbow Chart Reliable?
The Crypto Rainbow Chart is a useful tool, but not entirely reliable; it should be used alongside other analysis methods. Based on historical data, it can offer insights but cannot predict future events with complete accuracy. Many experienced traders incorporate it into their strategies, combining it with other indicators like moving averages and volume analysis for better decision-making.
Limitations of the Crypto Rainbow Chart
1. Historical Data-Based
The Crypto Rainbow Chart relies on historical price data to create its color bands, and this means it may not always be accurate in predicting future market conditions, as cryptocurrency markets can be influenced by a variety of factors that may not be reflected in past trends.
2. Limits to Bitcoin
While the Crypto Rainbow Chart is effective for Bitcoin, its applicability to other cryptocurrencies may be limited. Each cryptocurrency has its own unique price movements and cycles, so the chart may not be as effective for altcoins.
3. Does Not Account for Market Events
The chart does not take into account sudden market events, news, or macroeconomic factors that can cause sharp price movements. It’s crucial to consider other information sources in conjunction with the chart.
Conclusion: Enhancing Your Crypto Investment Strategy
The Crypto Rainbow Chart provides a visually appealing way to assess Bitcoin’s market conditions, helping you identify potential buying and selling opportunities to enhance your trading strategy. Remember, no chart is perfect, so it’s essential to use it alongside other methods for a comprehensive analysis. For expert advice and resources, consider partnering with Crypto Green Force.

Frequently Asked Questions (FAQs)
1. What is the Crypto Rainbow Chart?
The Crypto Rainbow Chart visually tracks Bitcoin’s price movements using color bands to indicate whether the market is overbought, oversold, or neutral.
2. How do I use the Crypto Rainbow Chart for trading?
Buy when Bitcoin is in the blue or purple bands (oversold) and consider selling when it’s in the red or orange bands (overbought).
3. Is the Crypto Rainbow Chart accurate?
The chart relies on historical data and may not always predict future price movements. It is best used alongside other tools for insights.
4. Can the Crypto Rainbow Chart be used for other cryptocurrencies?
While designed for Bitcoin, similar charts can be created for other cryptocurrencies, though each has its own market cycle.